Mine have always been a bit functional, and I’m curious what more creative people have achieved.
Anyone fancy showing off what they’ve put together? Feel free to blank out personal information, obviously.
And on another note, I’m now moderating this sub. Hi!
Let me know if there is anything you’d like to see added to the sidebar, I’m aiming to update it over the next few days.


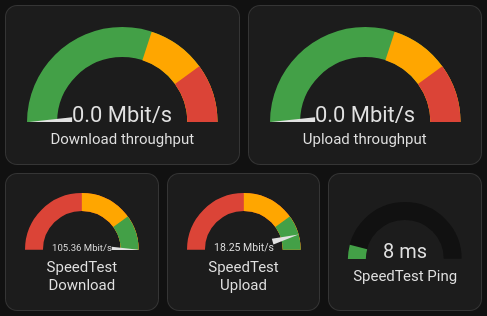
My “What’s the internet connection up to?” card:

My “Leaving the house” card:

It’s nice to compare the local predicted temperature, and local sensor.
Drive time to work is a great idea!
Currently, it’s using a Waze integration.
The coolest thing, is that it’s given me a really nice data set for when are the bad times to drive across town are. (Sadly, it’s during the morning and afternoon school runs).
It also reveals that the travel time on average is impacted significantly by the school holidays, and the weather.
Ooooooo bby.
What integrations did you use for all those lovely dials and what config did they need? I would like to shamelessly copy!
Good news: The gauge card is a standard component.
It is indeed! Mostly just fiddling around with the settings.
@[email protected], here is a paste of the config so you can play with it:
(If you click show code editor, then paste in, you can then go back to visual editor with things configured)
Speedtest needle gauges and ping with colour change:
type: horizontal-stack
cards:
  - type: gauge
    min: 0
    severity:
      green: 80
      yellow: 50
      red: 0
    entity: sensor.speedtest_download
    max: 100
    needle: true
  - type: gauge
    min: 0
    max: 20
    entity: sensor.speedtest_upload
    severity:
      green: 16
      yellow: 10
      red: 0
    needle: true
  - type: gauge
    min: 0
    entity: sensor.speedtest_ping
    severity:
      green: 0
      yellow: 15
      red: 20
    max: 100
Air quality with lots of different colours:
type: horizontal-stack
cards:
  - type: gauge
    entity: sensor.oxford_air_quality_index
    needle: false
    min: 0
    max: 500
    segments:
      - from: 0
        color: '#00e400'
      - from: 51
        color: '#ffff00'
      - from: 101
        color: '#ff7e00'
      - from: 151
        color: '#ff0000'
      - from: 201
        color: '#8f3f97'
      - from: 301
        color: '#800000'
    name: 'Air quality: PM2.5'
    unit: µg/m3
  - type: gauge
    entity: sensor.external_environment_f
    max: 40
    severity:
      green: 18
      yellow: 25
      red: 30
    needle: false
    min: -10
  - type: gauge
    entity: sensor.oxford_uv_index
    max: 10
    severity:
      green: 0
      yellow: 3
      red: 6
Once you’ve got your head around horizontal stacks (lets you put multiple small dials together), it’s mostly picking thresholds and settings colours.
@GreatAlbatross @homeassistant I love a good gauge 😀
Cheers! I’ll let you know if I get it working (in several weeks when I actually have a chance for tinkering!)
I’m glad I glanced in here. I recently deleted everything and had to start again, but MET office was broken on my old install so I never tried again.
Your screenshots made me reinstall, and my phone remembered my Met office logins (bonus) so it took seconds. And it works!
It was broken for a few weeks of 2024.2 (I think). I ended up learning how to do a manual downgrade while they fixed it!
What did you use to get the information for the current internet throughput?
It’s pulled from my main router using it’s metric for it. It only updates once a minute or so, but it’s a nice metric.
Once I switch over to more powerful gear, I’ll probably have to start using SNMP, which I don’t look forward to!